

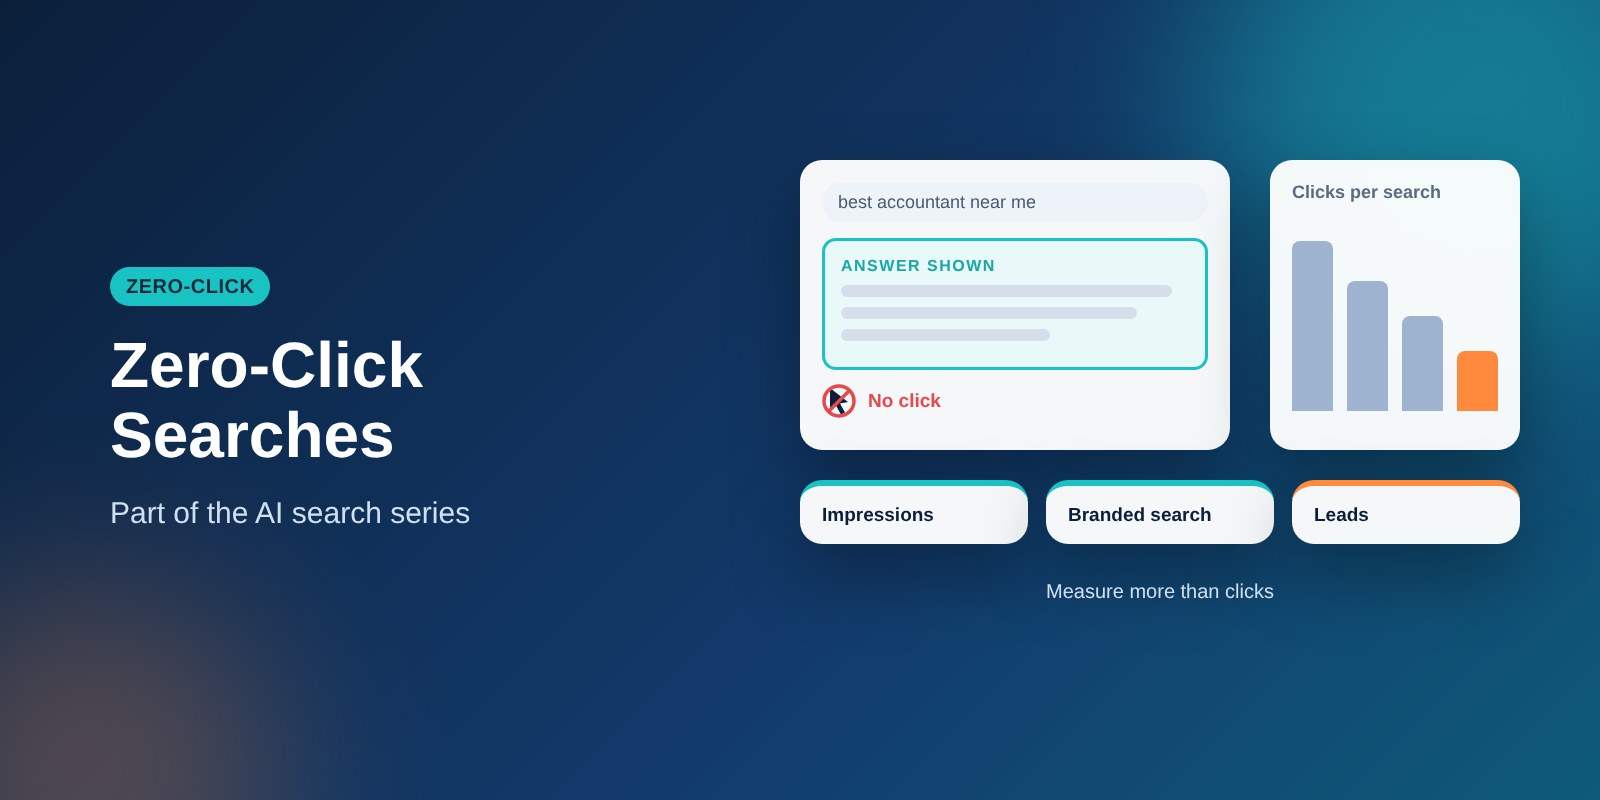
If your organic traffic has softened, AI answers may be part of the reason. A roundup of zero-click research by SearchLogistics cites a 2026 estimate that about 68% of US searches ended without a click to the open web (Similarweb, via SparkToro). It also reports Pew Research finding that people clicked a traditional result in 8% of sessions with an AI Overview versus 15% without.
The studies measure different things in different ways, so treat the exact figures with care. The direction is consistent: fewer clicks per search when an answer is shown.
This post explains why that changes how you should judge SEO, which numbers to track instead, and how to explain the shift to a boss or client.
What zero-click means
A zero-click search is one where the person gets what they need on the results page and never visits a website. Weather, quick facts, maps, featured snippets and now AI-generated summaries all contribute.
It does not mean nobody saw your brand. It means the visit that used to be recorded as a session may no longer happen. That is a measurement problem as much as a marketing one.
Why clicks alone are now a weak scorecard
A customer can learn your name from an AI answer, search for you later, and call without ever clicking a link. Your analytics records that as a branded search or a direct visit, if it records anything at all.
Google also says that sites appearing in AI Overviews and AI Mode are counted in overall search traffic in the Search Console Performance report, under the Web search type. You can read this in its guidance on AI features and your website. That means you cannot easily split out exactly what AI answers do to your numbers, which is one more reason to look at several measures together.
Measures that tell the fuller story
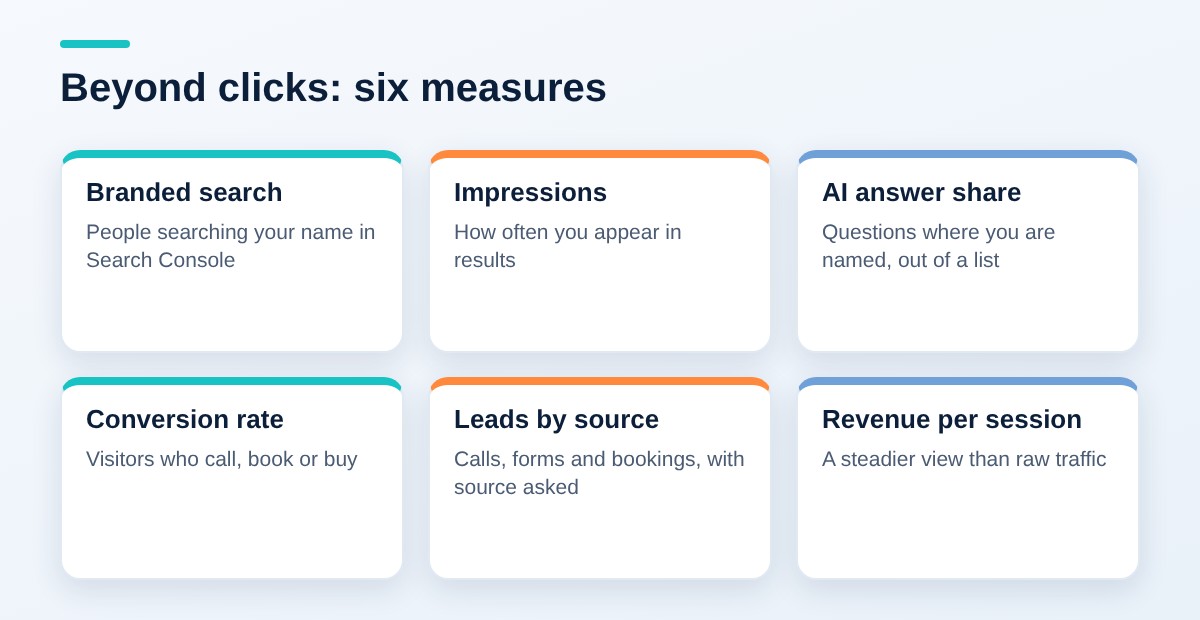
- Impressions and branded search: in Search Console, track how often you appear and how often people search your name.
- Share of AI answers: out of a fixed list of customer questions, how many name your business?
- Conversion rate: fewer visits matter less if the visits that remain convert better.
- Leads by source: track form fills, calls and bookings, and ask how people found you.
- Revenue per organic session: a steadier figure than raw traffic.
How to set each one up
Impressions and branded search. In Search Console, filter queries that contain your business name and its common misspellings. Compare the last three months with the same period a year earlier. Rising branded impressions with flat clicks can signal growing awareness.
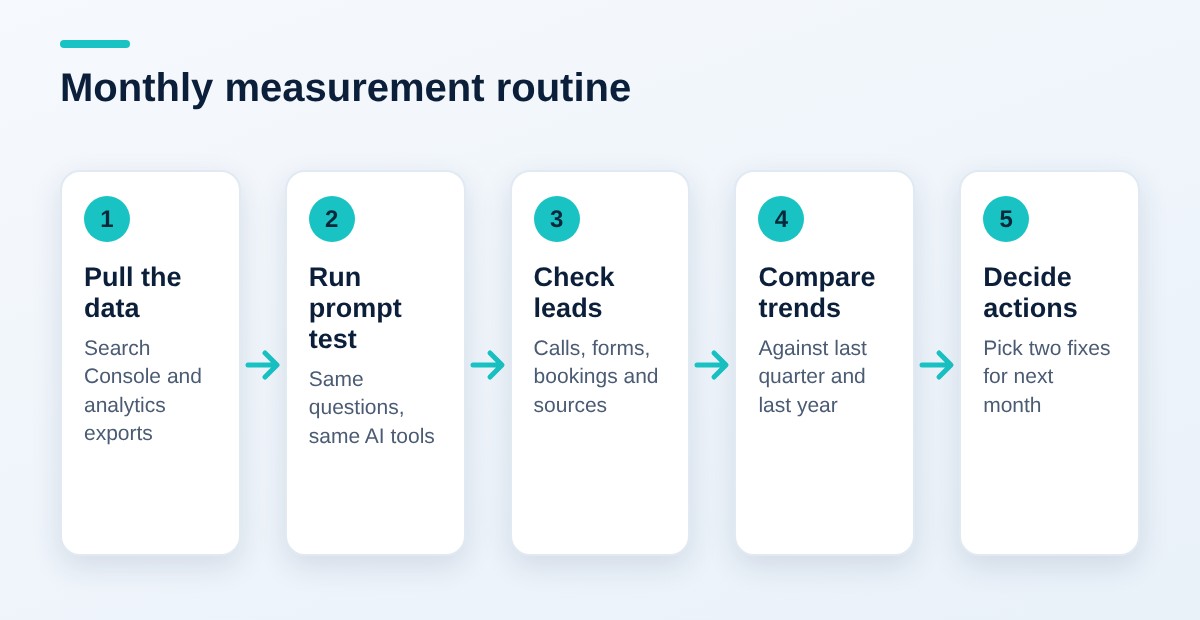
Share of AI answers. Write 15 to 20 questions your customers ask. Run them monthly in the main AI tools and log whether you are named and whether you are linked. Use the same list each time so changes mean something. Answers vary from run to run, so treat results as a trend, not an exact score.
Conversion rate and leads by source. Set up goals or key events for calls, forms and bookings. Add a simple “how did you hear about us?” field with options such as search, AI assistant, friend or ad. Free-text answers often reveal AI mentions that analytics misses.
Revenue per organic session. Divide revenue or lead value from organic search by organic sessions. If sessions fall but this number rises, the traffic that remains is more valuable.
A sample monthly dashboard
Keep the report to one page. These columns work for most small businesses.
| Measure | Where to find it | What to look for |
|---|---|---|
| Organic clicks and impressions | Search Console | Direction over several months, not week to week |
| Branded search impressions | Search Console | Steady or rising awareness |
| AI referral sessions | Analytics source reports | New sources appearing, even if small |
| Prompt test results | Your own log | Times named and cited out of your list |
| Leads and bookings | CRM or call tracking | Volume and quality by source |
| Self-reported source | Form field or intake call | Mentions of AI tools or articles |
How to respond
- Focus content on topics where the click is still necessary, such as comparisons, tools, pricing and booking.
- Aim to be cited in answers, where cited pages tend to fare better than uncited ones.
- Make the next step obvious for the visitors who do arrive.
Where the click still happens
Some intentions are hard to satisfy with a summary. A buyer who wants to compare real prices, use a calculator, check availability, view a portfolio or book an appointment needs a site.
Review your top pages and ask what a visitor can do there that an answer cannot provide. Strengthen those features and make them easy to find.
Make every visit count
- Put the main action, such as call, book or request a quote, above the fold.
- Show phone numbers as tap-to-call links on mobile.
- Reduce form fields to what you need to respond.
- Check that pages load quickly on a phone.
Common mistakes
- Judging only by sessions. A traffic dip can hide stable or growing leads.
- Dismissing the data. If leads are falling too, the issue is real and needs action.
- Chasing traffic with low-value content. Informational pages that attract clicks but never convert are the most exposed.
- Changing the prompt list each month. You lose the ability to compare.
- Over-trusting one study. Estimates vary by method, country and query type.
Reset expectations internally
Tell your team or clients up front that the success measures are changing. A flat traffic line with rising leads can mean the strategy is working.
Share the new dashboard before a bad month happens. People accept a new scorecard more readily when it is agreed in advance than when it appears as an excuse. Be open about what you cannot measure, such as the people who saw your name in an answer and never clicked.
A short example of reading the numbers
Imagine a generic local service firm whose organic sessions fall over six months while phone calls stay level and branded searches rise. Read alone, the traffic line suggests decline. Read together, the picture suggests the same demand is reaching the business through different paths.
The opposite case matters too. If sessions, calls and branded searches all fall, the problem is probably real visibility, and the audit and content work should start at once. The point of a wider scorecard is to tell these two situations apart.
Where to start this week
- Pull 12 months of Search Console data and chart clicks, impressions and branded queries.
- Write your list of 15 to 20 customer questions and run the first prompt test.
- Add a “how did you hear about us?” question to your main form or intake call.
- List your top five landing pages and check each for a clear next step.
- Book a short meeting to agree the new monthly scorecard.
Key takeaways
- Studies point to fewer clicks per search when an answer is shown, though the figures differ by method.
- Sessions alone no longer capture the value of search visibility.
- Track impressions, branded search, share of AI answers, conversions, leads and revenue per organic session.
- Ask customers how they found you; it reveals what analytics misses.
- Invest in content and features where the visit is still needed.
- Agree the new scorecard with your team before results shift.
Related: AI Search for Business: How to Get Found in ChatGPT, Google AI Overviews and Perplexity
Want to see where your business stands in AI answers today? Contact SEO Now for an AI search visibility review.